Material below summarizes the article Exploring Individual Brain Connectomes With Topological Data Analysis in ADHD, published on April 21, 2020, in eNeuro and authored by Zeus Gracia-Tabuenca, Juan Carlos Díaz-Patiño, Isaac Arelio, and Sarael Alcauter.
Highlights
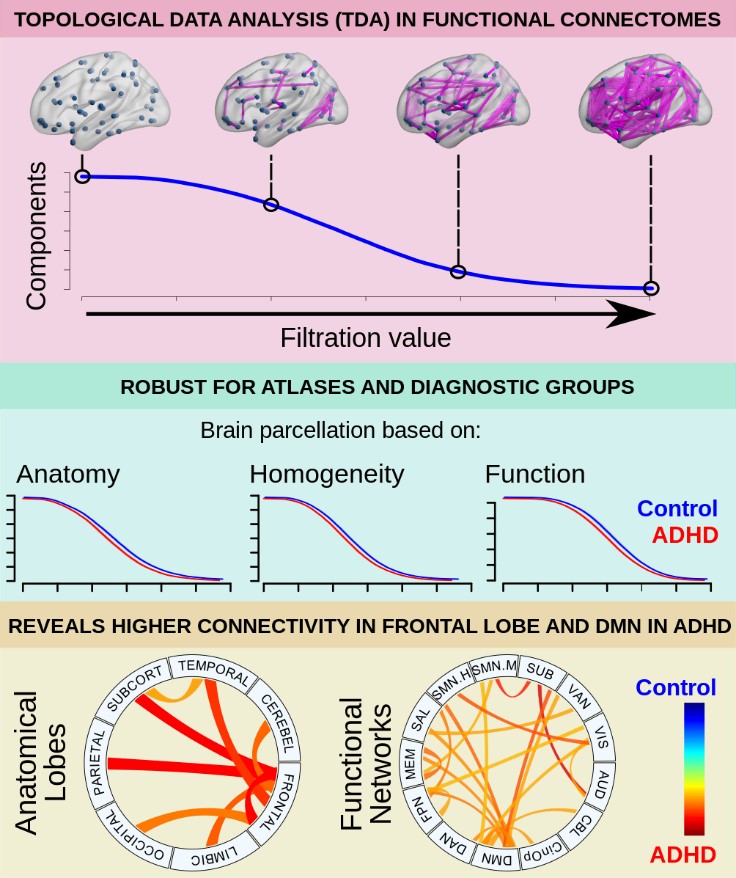
- Topological Data Analysis (TDA) showed significant differences between ADHD and typically developing children.
- Such differences are not dependent on how we segment the brain into multiple regions.
- ADHD patients showed higher connectivity than controls. Particularly, two high-order or association networks showed the most increases in connectivity: the frontal lobe and the default mode network.
|
|
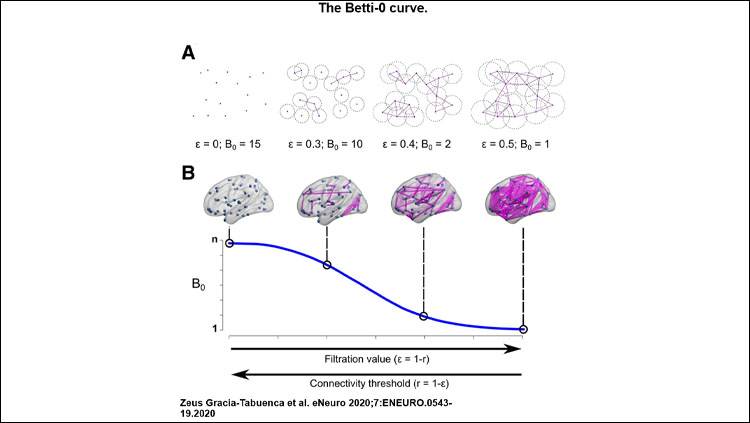
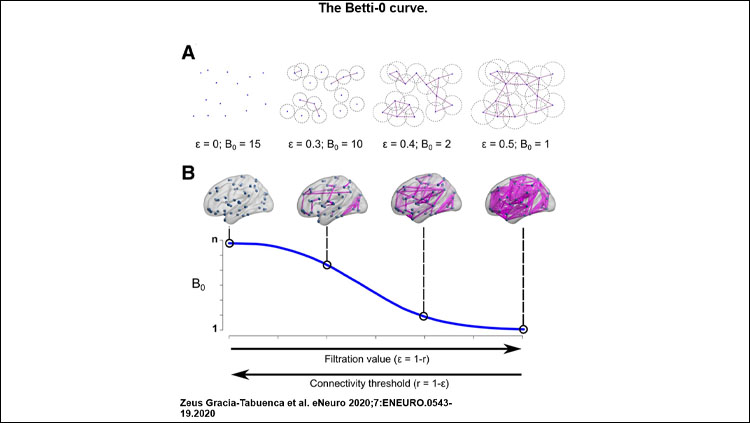
Figure from "Exploring Individual Brain Connectomes With Topological Data Analysis in ADHD," published on published on April 21, 2020, in eNeuro and authored by Zeus Gracia-Tabuenca, Juan Carlos Díaz-Patiño, Isaac Arelio, and Sarael Alcauter.
|
Study Question
Topological Data Analysis (TDA) is a mathematical framework that extracts high-dimensional information from complex systems. In this study, we asked, What insights can we obtain when modeling the brain network as a topological space (a set of connected points)? Are these insights robust when using different brain parcellations? And, can we differentiate controls from ADHD patients using TDA?
How This Research Advances What We Know
The brain is a complex system of interacting elements at different anatomical and temporal scales. A common approach to explore such a system involves modeling the brain as a complex network or connectome, and using some metrics to capture brain organization properties, such as global integration or local segregation. For example, regarding ADHD, some studies have related this developmental disorder with a disruption of attentional systems that usually involve the communication between the anterior and posterior parts of the brain (fronto-parietal), while others have stressed global effects to the brain. However, the results of these studies vary depending on how the brain regions are defined, in other words, how the brain is segmented or divided into several regions. But the results may also change depending on how we define if two brain regions are synchronized or not. This is usually done by a simple metric, the correlation between their activity patterns, these being measured with functional MRI in this case. But still, we have to define a quantitative threshold for the correlation values to define if two brain regions are in synchrony or not. Different thresholds may yield variable results, complicating the interpretation of findings. Instead of selecting a single connectivity threshold, here we explored how the brain network changes as a function of the connectivity threshold (exploring the whole range of possible thresholds), and if this pattern of change is different between ADHD and controls. We also tested how robust the results are when using different brain segmentation schemes.
Experimental Design or Methodology
Resting-state fMRI scans from 96 controls and 81 ADHD patients (7-18 years old) were studied. From this, we can build a connectome for each session taking the pairwise synchrony (Pearson's cross-correlation) of the fMRI signal along multiple regions of the brain. Then we can measure how fast different regions of the brain bind together if we change the synchrony threshold; in human connectomes this transition has an inverse S-shape curve (top figure). In TDA terms, this is called the B0 curve. We test the robustness of the B0 curves using different brain segmentations (based on anatomy, function, and homogeneity). Can diagnostic groups be differentiated by the B0 curves? And if yes, where are these differences more patent?
Results
We found that the area-under-the-curve (AUC) of the TDA's B0 curves are highly consistent no matter how we divide the brain (if based on anatomy, function, or homogeneity). Regarding group inferences, ADHD group showed lower AUC compared to controls. That means that the ADHD connectome binds together faster than controls when changing the synchrony threshold, in other words, the connectomes of the ADHD patients are over synchronized compared to those of controls. In addition, this pattern was more prominent for the interactions of the frontal lobe and the default mode network, which is consistent with the hypothesis of altered attentional fronto-parietal systems.
Interpretation
Our results showed that the connectomes of ADHD patients have stronger connections than those of the controls. We also showed that these differences between diagnostic groups are robust, and not dependent on how we segment the brain. Moreover, we identified that the main differences between ADHD and controls involve the interactions of the frontal lobe and the default mode network, important brain systems whose alterations have been related to attention deficits. Our results seem consistent with the hypothesis of the alteration of fronto-parietal attentional systems.
TDA is a robust methodology that complements previous studies on the brain functional connectome. All computing code applied in this work is freely available (Extended Data 1, in the original publication), hence this approach can be further applied to other brain networks such as different species or different clinical populations.
Visit eNeuro to read the original article and explore other content. Read other summaries of eNeuro and JNeurosci papers in the Neuronline collection SfN Journals: Research Article Summaries.
Exploring Individual Brain Connectomes With Topological Data Analysis in ADHD. Zeus Gracia-Tabuenca, Juan Carlos Díaz-Patiño, Isaac Arelio, and Sarael Alcauter. eNeuro 21 April 2020, 7 (3) 0543-19.2020; DOI: 10.1523/ENEURO.0543-19.2020
About the Contributors
Zeus Gracia-Tabuenca is a PhD candidate in biomedical sciences, at the National Autonomous University of Mexico (UNAM).
Juan Carlos Díaz-Patiño holds a PhD in mathematics from the Universidad National Autonomous University of Mexico (UNAM).
Isaac Arelio holds a PhD in mathematics from the Universidad National Autonomous University of Mexico (UNAM).
Sarael Alcauter is an assistant professor in the department of behavioral and cognitive neurobiology at the Institute of Neurobiology, National Autonomous University of Mexico (UNAM).
 Neuroinformatics in the Age of Big Data: Working with the Right Tools
 Exploring Individual Brain Connectomes With Topological Data Analysis in ADHD
 Neural Connectivity and Connectomics Journal Articles


